Having fun afloat comes in many forms. For some it’s anchoring in a deserted bay, for others its taking the kids for a blast along the coast whilst for others its using your skills to execute a passage from A to B using the latest electronics to smooth your journey.
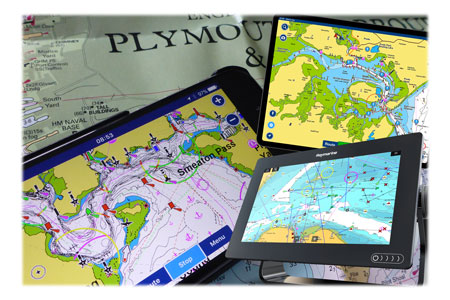
There’s no doubt that for making passages the primary tool in a boaters toolbox is the chartplotter. They are generally simple to use, contain a range of great features and with some of the more advanced systems allow you to link between your devices such as phones/tablets and the chartplotter itself.
In this article we’ll look at some of the great features of these tools and also some of the limitations that you need to keep in mind when you use them.
A chartplotter is a simple concept. Basically it’s a photo of a paper chart with your boat’s position superimposed on it. As technology has progressed these charts have been digitized allowing users to switch some detail off – sometimes this is good but there’s a danger you remove some data that’s important – like rocks! The electronic charts within chartplotters are increasingly accurate but beware that they may not always be 100% correct as they are not required by law to be in the way paper charts are. As time passes this is less of an issue and accuracy improves and errors (generally) get removed.
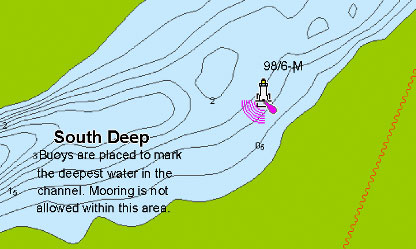
This is a snapshot of the Navionics chart for Poole Harbour which was only recently updated. This buoy with a light and fog horn simply doesn’t exist. Whilst this one has been removed there still remains another tower with a light and a foghorn showing as existing in the harbour which again doesn’t exist.
The main way that chartplotters are used by power/motor boaters is to have the chart image in front of them allowing them to track progress along a channel into a harbour or estuary or in the approach to the marina. There’s no doubt that this is a great feature to use but when you use a chartplotter for this there’s a need to understand the potential issues that could arise and the possible limitations of the system.
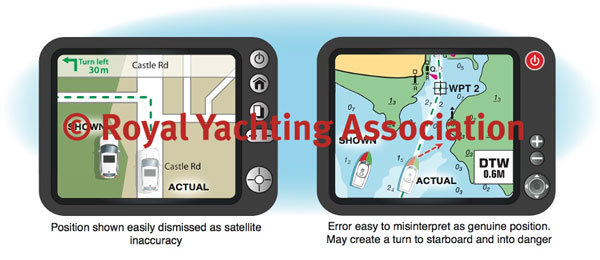
So how accurate is your chartplotter? The GPS system which feeds your chartplotter its position is generally really accurate – better than 15 metres 95% of the time. This means though that 5% of the time the accuracy may be less good and this could be 16m or 300m+. Does this matter though? At sea, away from land, an error may not matter but in a narrow channel being even 30m out of position could really cause you some big issues. Part of the problem is noticing when this error is present – in a car it’s pretty obvious when your satnav has an error as you will see your car driving off the road. Obviously you know this is an error as it’s easy to see but when afloat you could be far from any obvious mark when you get such an error the result being that you ‘correct’ your position and inadvertently take the vessel into danger. The image shows this concept. The solution for this we’ve covered in previous articles – having a pilotage plan to use with your chartplotter and chart – a robust multilayered approach.
So what of these great features?
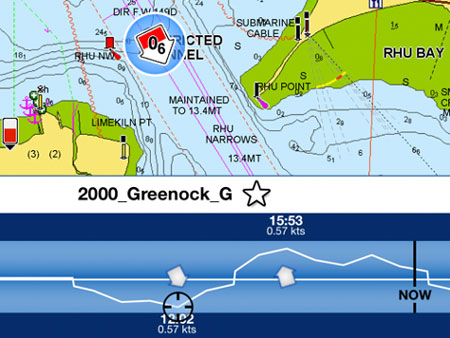
Tidal information: There are plenty of apps and websites that give you tidal height information although getting it from your chartplotter or chartplotter software is a really handy way to do so – especially as it shows you clearly what area this tidal information relates to. The really good part though is the way that you can get tidal stream information. Arrows on the chart show rate and direction and clicking on them gives you access to how this tidal flow will change over the next few hours or even days/weeks if planning a trip. This is a really great, visually simple way to get this information
Depth information: Of course all charts tell you what the minimum depths will be at the lowest tides but one of the features that’s a recent addition is the ‘crowd sourcing’ of depth information. Take a lake like Windermere. There is a basic chart available but it doesn’t give any depth information as the area is not properly surveyed. Many boaters though have plotters and depth gauges which link to their Navionics account. As they trundle around the lake they capture depth information which is then shared to Navionics. They then consolidate this giving you the option to view the depths across the lake using this information sourced from others – very clever and potentially hugely useful.
Planning at home: Today’s busy lifestyles struggle to afford us the time to get our charts out look at the places we want to go, to peruse various charts and then write down the waypoints and routes for our passage. The systems like Navionics allow us to view where we want to go from the comfort of our sofa, plan waypoints and routes then as we switch on the plotter on our boat our planning automatically uploads to our plotter using wifi – very clever!
Be careful though as not all ideas by these chart providers are great. Some manufacturers introduced a few years ago a feature called autorouting. Plonk a cursor where you want to go and choose this option and knowing the tidal heights and draught of your vessel the plotter will work out a route. In theory this is a nice idea but, in my opinion, this has the potential for creating a potentially dangerous route.
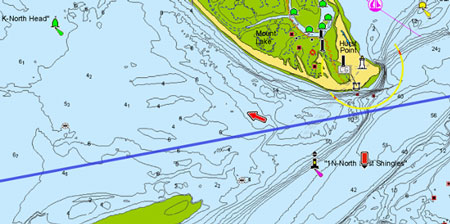
Take this small snapshot of a Poole to Yarmouth route which, because depth exists, takes you route near the Shingles Bank which I wouldn’t choose as the actual channel further north is a better route. In fairness the system tells you as Skipper you have to choose a safe route but for many, using this feature may be too tempting.
In summary, embrace these new tools as they are really great and make boating easier and more fun but beware of their shortcomings. Have fun afloat!
Note: In this article we’ve used mainly screenshots from the iPad based Navionics App. This Navionics app is the same charting software used in many plotters and whilst the way the data is presented may vary between products they all now do much the same.
This article was adapted from an article originally written by Powerboat Training UK for Powerboat & RIB Magazine and published in 2019. The article is based on the relevant sections from the RYA Powerboat Handbook.
The RYA Powerboat Handbook is available from the RYA Shop either as a paperback or as an eBook.
